Uploads by Bidaurratzaga Eider
From Bioblast
This special page shows all uploaded files.
| Date | Name | Thumbnail | Size | Description | Versions |
|---|---|---|---|---|---|
| 14:28, 4 July 2013 | SeverinF.jpg (file) |  |
3 KB | 1 | |
| 09:40, 5 August 2013 | SlindeE.jpg (file) |  |
4 KB | 1 | |
| 09:24, 16 August 2013 | SchifferT.jpg (file) |  |
4 KB | 1 | |
| 14:03, 23 August 2013 | BorutaiteV.jpg (file) |  |
4 KB | 1 | |
| 09:19, 16 August 2013 | LarsenF.jpg (file) |  |
5 KB | 1 | |
| 09:58, 26 August 2013 | PetitP.jpg (file) |  |
5 KB | 1 | |
| 12:15, 16 August 2013 | SchulteP.jpg (file) |  |
7 KB | 1 | |
| 08:11, 16 July 2013 | AlbuquerqueJP.jpg (file) |  |
8 KB | 1 | |
| 16:17, 14 August 2013 | JoseC.jpg (file) |  |
8 KB | 1 | |
| 15:12, 9 July 2013 | BandmannO.jpg (file) |  |
9 KB | 1 | |
| 11:41, 4 July 2013 | PinkertC.jpg (file) |  |
10 KB | 1 | |
| 08:53, 21 August 2013 | ScottG.jpg (file) |  |
10 KB | 1 | |
| 12:07, 16 August 2013 | OliveiraM.jpg (file) |  |
11 KB | 1 | |
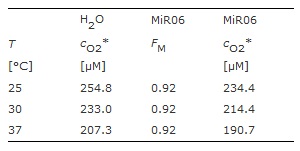
| 12:25, 29 November 2013 | MiPNet06.03 Table.jpg (file) |  |
12 KB | cO2* is the oxygen concentration at thermodynamic equilibrium with air under standard conditions of 100 kPa barometric pressure. FM has been determined for MiR05 at 30 °C and 37 °C, and is assumed to be identical at 25 °C. | 1 |
| 15:56, 14 August 2013 | GavenauskasB.jpg (file) |  |
12 KB | 1 | |
| 10:27, 16 August 2013 | LundbyC.jpg (file) |  |
12 KB | 1 | |
| 09:34, 16 August 2013 | StaplesF.jpg (file) |  |
13 KB | 1 | |
| 17:50, 29 November 2013 | MiPNet14.14.jpg (file) |  |
14 KB | 1 | |
| 09:12, 25 July 2013 | VercesiA.jpg (file) |  |
15 KB | 1 | |
| 13:18, 4 July 2013 | LeeHK.jpg (file) |  |
15 KB | 1 | |
| 08:10, 17 July 2013 | MenzeM.jpg (file) |  |
16 KB | 1 | |
| 14:24, 4 July 2013 | PajueloD.jpg (file) |  |
19 KB | 1 | |
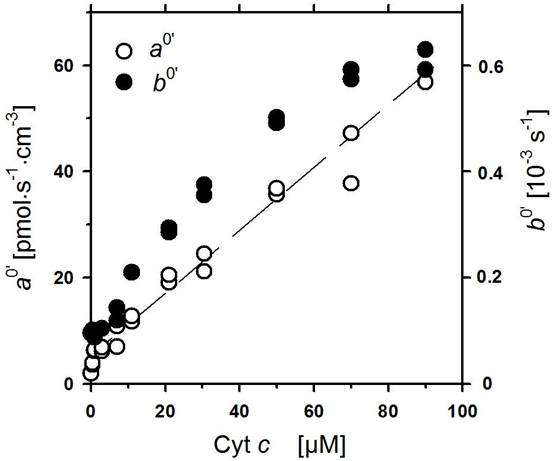
| 14:45, 29 November 2013 | MiPNet06.06 Fig2.jpg (file) |  |
22 KB | Fig. 2. Parameters of chemical background oxygen flux with TMPD+ascorbate as a function of cytochrome c concentration (Cyt c [μM)]. ao’ intercept and bo’ slope of linear part of oxygen dependence, from Fig. 1. | 1 |
| 08:52, 3 October 2013 | MiPNet15.00 mt-Inhibitors-Uncouplers.pdf (file) | 23 KB | 10.07.2021 | 1 | |
| 09:12, 5 August 2013 | ShigaevaM.jpg (file) |  |
23 KB | 1 | |
| 09:59, 16 August 2013 | BlierP.jpg (file) |  |
25 KB | 1 | |
| 11:07, 22 July 2013 | ArandarcikaiteO.jpg (file) |  |
27 KB | 1 | |
| 16:01, 11 September 2013 | Garcia-Rivas.jpg (file) |  |
29 KB | 1 | |
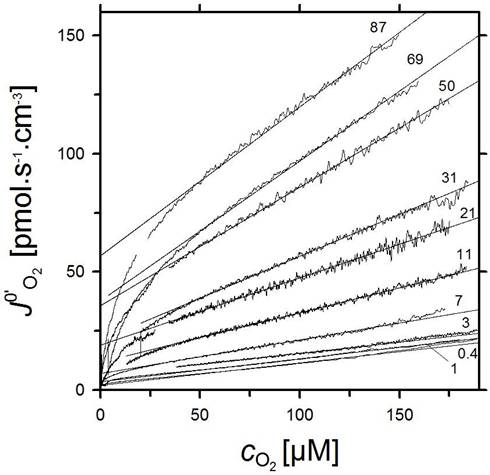
| 14:45, 29 November 2013 | MiPNet06.06 Fig1.jpg (file) |  |
33 KB | Fig. 1. Continuous records of chemical background flux with 0.5 mM TMPD, 2 mM ascorbate, and various cytochrome c concentrations (μM, indicated as numbers at each curve), plotted as a function of oxygen concentration. Measured at 30 °C in mitochondrial | 1 |
| 15:42, 9 July 2013 | Plecita-HlavataL.jpg (file) |  |
34 KB | 1 | |
| 13:22, 4 July 2013 | KotwicaA.jpg (file) |  |
35 KB | 1 | |
| 14:17, 17 July 2013 | NAMDC.JPG (file) |  |
35 KB | 1 | |
| 16:46, 14 August 2013 | WieckowskiM.jpg (file) |  |
37 KB | 1 | |
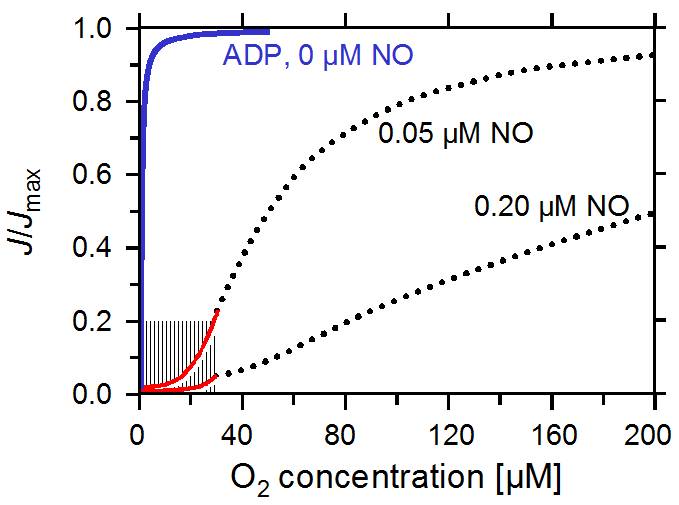
| 12:21, 29 November 2013 | MiPNet08.12.jpg (file) |  |
37 KB | Figure 1. Oxygen dependence of mt-respiration and competitive inhibition by NO. The full line shows oxygen kinetics at state 3 with pyruvate and malate in the absence of NO, measured in the physiological oxygen range (from Gnaiger et al. 1998a). Dotted li | 1 |
| 15:52, 29 November 2013 | MiPNet08.16.jpg (file) |  |
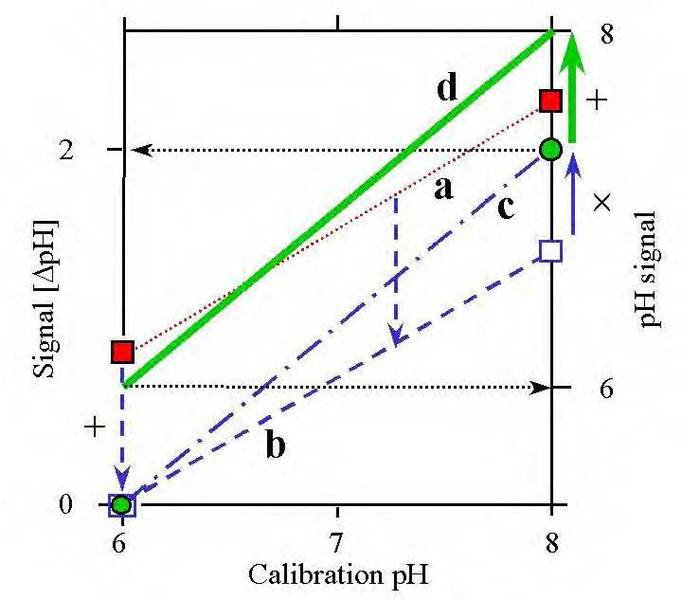
37 KB | Figure 1. Principle of a two-point calibration of a pH electrode system, at pH 6.00 and 8.00. (a) Signal before calibration (dotted line); (b) Calibration at pH 6 at electronic zero (0 mV), using the zero adjustment (+; additive as shown by the downwards | 1 |
| 15:49, 14 August 2013 | AllenAM.jpg (file) |  |
39 KB | 1 | |
| 10:50, 29 November 2013 | MiPNet12.11.jpg (file) |  |
41 KB | Figure 1. Experiment 2006-12-14 CD-03.DLD | 1 |
| 08:47, 15 July 2013 | SkulachevV.jpg (file) |  |
47 KB | 1 | |
| 10:55, 29 November 2013 | MiPNet12.17.jpg (file) |  |
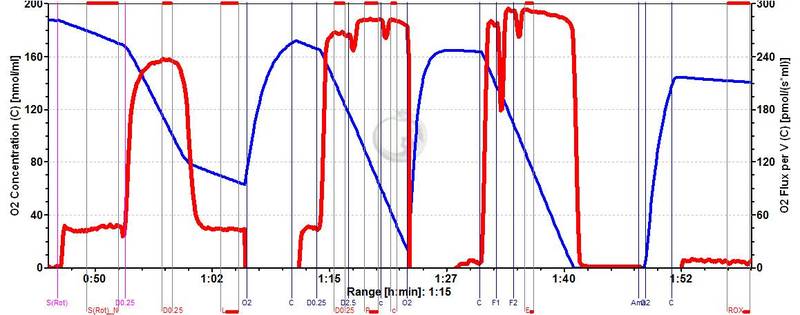
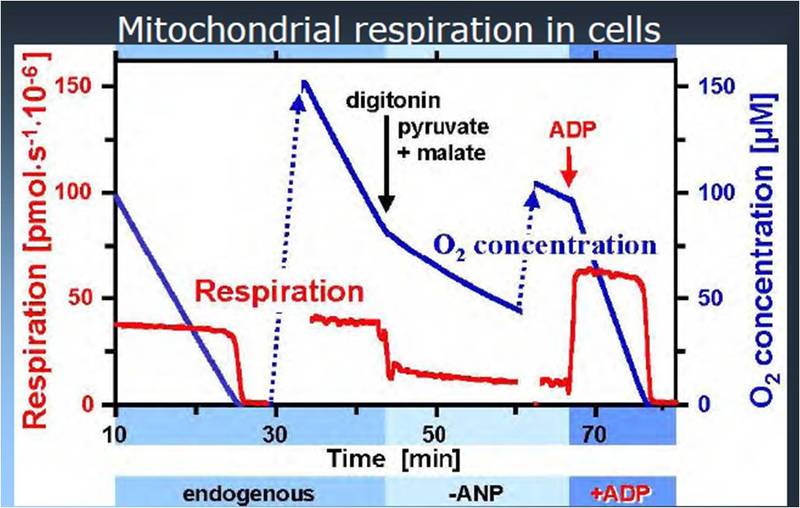
48 KB | Figure 1. Simultaneous display of oxygen concentration (blue lines) and oxygen flux (respiratory rate, red lines; negative time derivative of oxygen concentration) in chamber A and B. | 1 |
| 09:52, 16 August 2013 | DarveauC.jpg (file) |  |
49 KB | 1 | |
| 16:22, 8 July 2013 | Garcia-RovesP.jpg (file) |  |
49 KB | 1 | |
| 09:06, 5 August 2013 | BirA.jpg (file) |  |
51 KB | 1 | |
| 16:01, 9 July 2013 | TeppK.jpg (file) |  |
51 KB | 1 | |
| 14:09, 4 July 2013 | DungelP.jpg (file) |  |
54 KB | 1 | |
| 12:28, 29 November 2013 | MiPNet10.05.jpg (file) |  |
55 KB | 1 | |
| 12:02, 3 October 2013 | MiPNet IOC09 1994-O2k-Course-Innsbruck.pdf (file) | 57 KB | 1 | ||
| 11:58, 28 October 2013 | Gnaiger 1987 Hydrobiol.pdf (file) | 57 KB | 1 | ||
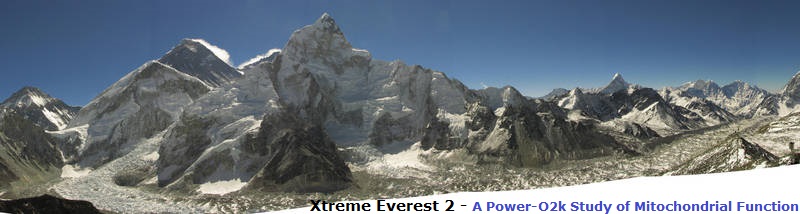
| 17:42, 28 June 2013 | Everest bioblast.jpg (file) | 60 KB | 3 | ||
| 08:14, 5 July 2013 | MunroD.jpg (file) |  |
68 KB | 1 | |
| 12:41, 29 November 2013 | MiPNet14.06.jpg (file) |  |
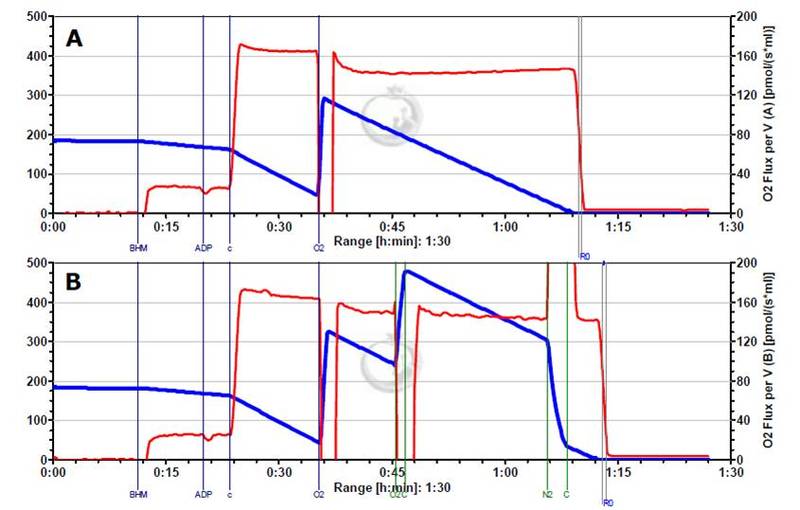
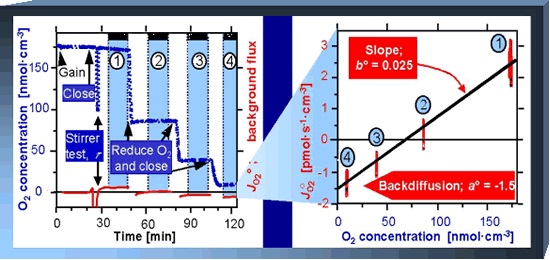
70 KB | Instrumental background experiment, measuring oxygen flux without biological sample at four oxygen levels (left), and linear relation between instrumental background oxygen flux and oxygen concentration (right). Modified after: Gnaiger E. (2001). | 1 |