Description
8-Hydroxypyrene-1,3,6-trisulfonic acid trisodium salt (HPTS) is a ratiometric pH fluorophore; pKa = 7.3. Relative molecular mass: Mr = 524.39
Abbreviation: HPTS
Reference: Sigma: H1529-1G
MitoPedia methods: Fluorometry
HPTS with the NextGen-O2k
Stock solution
- 2 mM: 5.2 mg / 5 ml H2O
Settings
- Blue: 0.5 mA, Intmax = 90 ms
- UV: 5 mA, Intmax = 400 ms
MF700
- X-003
- Hanks mod, 37 °C
- chamber A plus pH electrode , chamber b standard stopper
- Mode = 2
- UV 5 mA, blue 0.23 mA
- excitation ratiometric with one common integration range: 520 - 560 nm
- Int(max) (common) = 125 ms
- HPTS 2 µl 2 mM stock: 2 µM
- titrations:
- 3 x 2 µl NaOH 100 mM --> 3 x 0.2 mM
- pH 6.7 --> 6.8 --> 6.9 --> 7.0
- deprotonated endpoint: 2x 10 µl NaOH 100 mM: pH = 9.3
- protonated endpoint: 40 µl HCL 100 mM: pH = 6.0; + 10 µl HCl 100mM: pH = 4.8, + 5 µl HCl: pH = 4.0: rapid decline in signal !
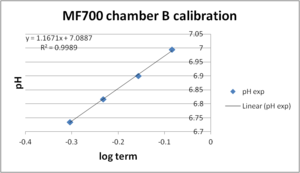
Results: Calibration with internal electrode in same chamber (chamber A) works very well (pKa = 7.03, slope = 1.04). Chamber B was calibrated against the pH values measured in chamber A. The quality of this calibration (pKa = 7.09, slope = 1.17) is lower than of the calibration for chamber A as visible in the slope value (should be 1.0 theoretically). However, this may be due to real pH differences in both chambers: E.g: After the last calibration injection there was a real pH drift (detected by both fluorescence and pH electrode) in chamber A not present in chamber B. Since chamber B was calibrated against the pH values measured in chamber A, differences in pH values would lead to an inferior calibration.
pH-Plot:blue : left chamber, pH electrode; cyan: left chamber fluorescence; green: right chamber fluorescence
Noise:
The noise was studied for the pH plots. Due to limitations in the export function of DatLab digital noise is visible even in the fluorescence based plots. However, the lower noise calculated for the electrode data noise = 0.1 mpH, dominated by digital noise) shows that the calculated noise is still mainly derived form "real" noise and not an artifact of DatLab export. The noise (standard deviation)from the fluorescence signal for a stable 5 minute period was determined to be between 0.2 and 0.3 mpH. These values are very close to those determined in SNARF#MA_153_2015-04-23 using 2 µM SNARF: 0.2 to 0.4 mpH. Considering that the conditions for HPTS could be further optimized but that on the other hand the noise determination with SNARF included a biological sample it seems that the the noise at equal fluorophore concentrations and the currently used light intensities is comparable for SNARF and HPTS.
Considering the very similar performance the toxicity of SNARF and HPTS should be compared to select a fluorophore.
Disadvantages HPTS:
- requires UV excitation
- at low currents (as used for HPTS) the efficiency differences between individual UV LEds are particular high. To achieve identical light intensities different currents should be selected for each LED. Therefore, it might be difficult to recommended a LED current for this application thats is good fro all LEDs.
Advantages HPTS:
- cheaper than SNARF
- more stable (room temperature)
- more expensive
- less stable


