Description
Safranin is one of the most established dyes for measuring mitochondrial membrane potential by fluorometry. It is an extrinsic fluorophore with an excitation wavelength of 495 nm and emission wavelength of 587 nm. Safranin is a potent inhibitor of N-linked respiration and of the phosphorylation system.
Synonyms: Safranin O, Safranin Y, Safranin T, Gossypimine, Cotton Red, Basic Red2
Abbreviation: Saf
Reference: Kauppinen 1984 Am J Physiol, Krumschnabel 2014 Methods Enzymol, MiPNet20.13 Safranin mt-membranepotential
MitoPedia O2k and high-resolution respirometry:
O2k-Open Support
Application in HRR
- Safranin O (C20H19ClN4) Sigma S2255, 25 or 100 mg, store at room temperature; M = 350.84 g·mol-1
- Caution: Light sensitive (store solution in a dark vial)!
- Preparation of 1 mM stock solution
- Weigh 3.508 mg of Safranin and dissolve in distilled water to reach 10 mL final volume;
- Divide into 0.5 mL portions (use dark vials);
- Store at 4 °C.
- Preparation of 1 mM stock solution
- »O2k manual titrations MiPNet09.12 O2k-Titrations
- Titration volume: in 1µL steps using a 10 µL syringe (2 mL O2k-chamber).
- Final concentration: 0.5-2 µM. Stepwise titration for calibration.
- »O2k manual titrations MiPNet09.12 O2k-Titrations
- A concentration of 2 µM Safranin can inhibit mitochondrial respiration.[1]
 O2k-Procedures: O2k-Fluorometry: HRR and simultaneous determination of mt-membrane potential with safranin. »MiPNet20.13«
Signal and output
- Signal: Both the O2k-Fluo Smart-Module and the O2k-Fluo LED2-Module are operated through the amperometric (Amp)-Channel of the O2k (labelled either “Fluo” or “Amp” depending on the O2k series and the O2k-Fluo Module), with electric current (ampere [A]) as the primary signal. In DL versions previous to DL8, the primary signal is converted to a voltage (volt [V]) as the raw signal.
- Fluo-Sensor: Smart Fluo-Sensor Blue equipped with Filter Set Saf
- Output: The focus of the output with Safranin is on Type III: Force, mt-membrane potential.
Safranin chemical background
- Several substances, typically used in SUIT protocols, may influence the fluorescence signal of safranin when injected into the O2k-chamber (for instance colored substances such as cytochrome c). These chemicals should be tested for their effect in a background run without a biological sample, and the necessary corrections are applied.
Substances with an effect on the fluorescence signal of safranin
Substances without an effect on the fluorescence signal of safranin
- Pyruvate (P)
- Malate (M)
- Glutamate (G)
- Digitonin (Dig)
- Oligomycin (Omy)
- CCCP (U)
- FCCP (U)
- Malonic acid (Mna)
- Antimycin A (Ama)
- DMSO
- Ethanol (EtOH)
- H2O2
- H2O
Calibration of the raw fluorescence signal
- To calibrate the raw fluorescence signal expressed as [V] and convert it to µM, you need to click on ´Calibration/A: or B: Amperometric, Amp´ to open Amp calibration window in DatLab.
SUITbrowser question: Mitochondrial membrane potential
- With the use of safranin, the mitochondrial membrane potential can be assessed by O2k-Fluorometry.
- Use the SUITbrowser to find the best protocol to answer this and other research questions.
Analysis of mitochondrial membrane potential using safranin
- Data analysis of mitochondrial membrane potential estimation using various fluorescence dyes: MiPNet24.09 General Template for Mt-membrane Potential Analysis to calculate the relative mt-membrane potential values.
- Data analysis of mitochondrial membrane potential estimation with safranin using DatLab 7.4: MiPNet24.08 Safranin Analysis Template to express the mt-membrane potential values in mV.
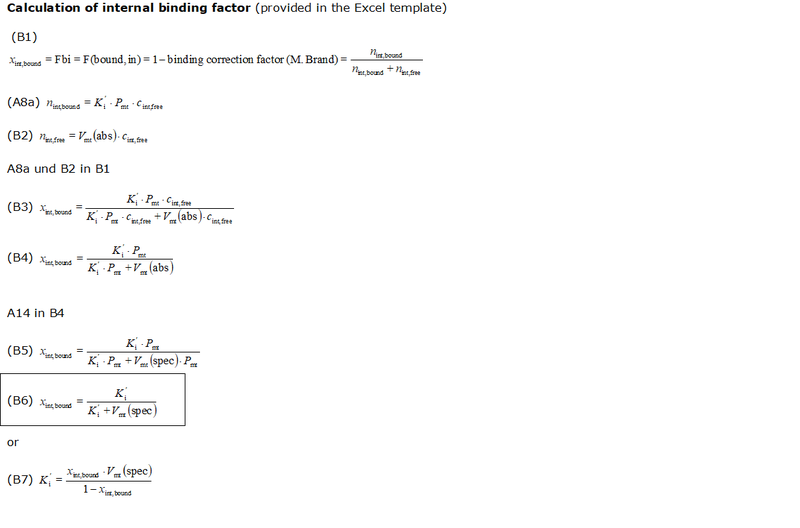
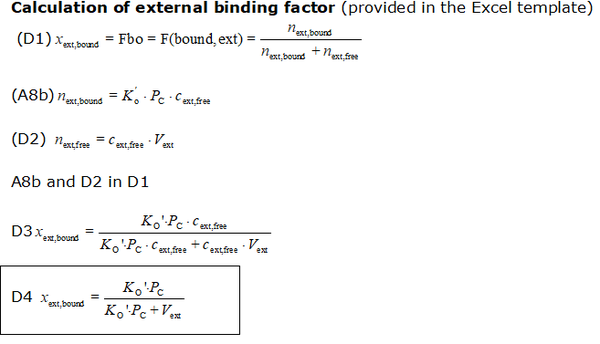
- The equations used to estimate the mt-membrane potential values in the Excel template are provided here complying with Oroboros transparency policy:
- For more detailed explanation on the equations, see MiPNet24.11 mtMP calculation
Abbreviations:
- cadded: titrated, free concentration of safranin [M = mmol/L]
- cext,free: free concentration of safranin outside mitochondria [M = mmol/L]
- ctotal: total concentration of safranin in the O2k-Chamber corrected for titration volume [M = mmol/L]
- ctotal,initial: total, initial concentration of safranin in the O2k-Chamber [M = mmol/L]
- Ki': apparent partition coefficient describing internal binding
- Ko': apparent partition coefficient describing external binding
- nadd: total amount of probe ions added to the system [µmol]
- Pmt: total mitochondrial protein content (as a marker for mitochondrial membrane content); in the case of isolated mitochondria: Pmt = Pc.
- PC: total cellular protein content (as a marker for cellular membrane and other material content); note that the mitochondrial protein content is accounted twice: in Pmt and in PC, this may be partially justified: while the outside of the mitochondrial membrane contributes to the external binding, the inside contributes to internal binding. However, also the outside of the cell membrane contributes twice. There is probably no numerical significance in this question, considering the low impact of external binding at reasonable high membrane potentials
- Vmt(abs): total mitochondrial volume in the system (O2k-Chamber) [µL]
- Vmt(spec): mass specific mitochondrial matrix volume (per mass of mitochondrial protein), [1 µL/mg]
- Vext: external volume: total solution volume outside mitochondria [µL]
- Vinj: titration volume [µL]
- Vtotal: O2k-Chamber volume [µL]
- Fbound,int: internal binding ratio; ratio of internally bound probe molecule to total amount of probe molecules taken up by the mitochondria
- Fbound,ext: external binding ratio; ratio of externally bound probe molecule to total amount of probe molecules outside of mitochondria
Correction for chemical background in the `1-calibration and chemical BG´excel sheet
- 1. Diluted Amp signal: diluted free safranin concentration corrected for chemical titration volumes
- 2. Titration correction of the diluted Amp signal:
- Titration effect of chemicals on the Amp signal calculated from the diluted Amp signal
Amp signaldiluted2 - Amp signaldiluted1
- Where:
- Amp signaldiluted2: Amp signal after the chemical titration corrected for the titration volume
- Amp signaldiluted1: Amp signal before the chemical titration corrected for the titration volume
- Where:
- 3. Titration correction of the measured Amp signal:
Titration effect of chemicals on the Amp signal calculated from the measured Amp signal
Amp signalmeasured2 - Amp signalmeasured1
- Where:
- Amp signalmeasured2: Amp signal after the chemical titration corrected for the titration volume
- Amp signalmeasured1: Amp signal before the chemical titration corrected for the titration volume Background correction factor = Titration correction of the measured Amp signal - Titration correction of the diluted Amp signal
- Where:
- 4. Correction factor: correction factor for the chemical background
Titration correction of the measured Amp signal - Titration correction of the diluted Amp signal
Correction for chemical background in the `2-biol exp calculation´ excel sheet
Cumulative BG correction factor [µM] = Cumulative BG correction factorbefore + background correction factorafter
- Where:
- Cumulative BG correction factorbefore: calculated cumulative BG correction factor of the previous titration
- Background correction factorafter: background correction factor after the titration
- Where:
Corrected Amp signal = Amp signal - cumulative BG correction factor = cout,free
Effect of safranin on mitochondrial respiration
HRR / Safranin,TMRM, Rhodamine 123
- The method is easy to use, since the Fluorescence-Sensor is not in direct contact with the sample. Transformation of the fluorescence signal of safranin, or TMRM or Rhodamine 123 to mtMP [mV] requires a specific method for each preparation and protein content, which has to be kept constant in an experimental series [2].
- » More details: »Discussion«.
Troubleshooting
TPP vs safranin
- Question: Safranin or TPP+ - which method to choose for mt-membrane potential detection?
- Answer: Absolute measurements of mt-membrane potential can be obtained with the TPP+ method by using unspecific binding correction factors. The safranin method works differently. A linear relationship between fluorescence intensity and mt-membrane potential is found for certain ranges and ratios of safranin and mitochondrial concentrations, to be determined experimentally. In conditions in which there is linearity, one way to calibrate the safranin fluorescence is actually to use the TPP calibration method, although there are other methods in the literature.
- Summarising the differences between the safranin and TPP+ methods are:
- If the absolute measurement of mt-membrane potential is required, TPP+ is the method of choice.
- If quantification of differences is sufficient, then safranin and TPP+ are both suitable.
- Safranin method is far easier to handle than the TPP method (no extra electrodes, no membrane mounting, no problem with carry-over of inhibitors by the electrode, etc.)
- Safranin can be added easily to many standard protocols and the changes in fluorescence intensity can be followed.
- Safranin is more sensitive in the range of low mt-membrane potential compared to TPP+.
- Depending on the sample, safranin or TPP+ might inhibit respiration to a higher extent which should be checked experimentally. This and other sample characteristics may make one method or the other more suitable.
- The decision also relies on the types of calibration methods that may be required.
- There is usually a benefit to having both methods available.
Safranin calibration
- Question: Do I need to calibrate the fluorescence signal with safranin?
- Answer: In many publications, e.g. Komary 2010 Biochim Biophys Acta, no calibration was done and only the plot of the fluorescence intensities is presented. The relationship between fluorescence and mt-membrane potential is entirely empirical. A linear relationship between fluorescence intensity and mt-membrane potential is found for certain ranges and ratios of safranin and mitochondrial concentrations. One way to calibrate the safranin fluorescence is actually to use the TPP calibration method. A simple two-point or multiple-point calibration for safranin concentration and a correction for chemical background effects are possible. A claimed linear relationship with the mt-membrane potential is based on the safranin fluorescence signal and not the actual safranin concentration.
References
- ↑ Krumschnabel G, Eigentler A, Fasching M, Gnaiger E (2014) Use of safranin for the assessment of mitochondrial membrane potential by high-resolution respirometry and fluorometry. Methods Enzymol 542:163-81. »Bioblast link«
- ↑ Sumbalova Z, Gnaiger E (2015) High-resolution measurement of mitochondrial membrane potential and respiration – comparison of potentiometric and fluorometric methods. Abstract MiP2015. »Bioblast link«
MitoPedia methods: Fluorometry
Labels: MiParea: Instruments;methods
Regulation: mt-Membrane potential
HRR: Oxygraph-2k, O2k-Fluorometer, O2k-Protocol, O2k-FluoRespirometer"O2k-FluoRespirometer" is not in the list (Oxygraph-2k, TIP2k, O2k-Fluorometer, pH, NO, TPP, Ca, O2k-Spectrophotometer, O2k-Manual, O2k-Protocol, ...) of allowed values for the "Instrument and method" property.
O2k-Core, DatLab, Safranin


