 |
Marks - DatLab |
MitoPedia O2k and high-resolution respirometry:
O2k-Open Support
Description
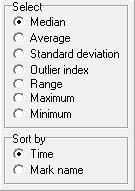
Marks in DatLab define sections of a plot recorded over time. Marks are set by the user in real-time, or post-experimentally for basic level data analysis. Set Marks to obtain the median, average, standard deviation, outlier index and range of the data within the mark, for calibration of the oxygen signal, flux analysis, or to delete marked data points. Marks are shown by a horizontal bar in the active plot. The default Mark names are given automatically in numerical sequence, independent for each plot. Rename marks individually by clicking into the horizontal bar, or use corresponding templates for renaming the entire sequence of marks. Several marks can be set on any plot.
Reference:
Setting marks
- Select the active plot by a left click or touch on the bullet of the plot on the right of a graph. The active plot is highlighted. Shift+L: Set the cursor on the starting position of the mark, hold Shift and press the left mouse button, while moving the cursor along the x-axis. Shift+R: The period of a mark may be reduced or the entire mark deleted by holding Shift and pressing the right mouse button, while moving the cursor along the x-axis over the marked section.
- Problem: Graph scaling window opens when setting a mark
- When setting a mark on a plot, the Scaling window may appear. This happens if the mouse cursor is set on the time axis.
- Solution: Set marks with the mouse cursor pointed above or below the time axis.
Mark names
- Default mark names: Marks are labelled with consecutive letters by default, starting from "a", independent of the sequence of position of the marks. When deleting a mark (Shift+right click), then this mark letter is missing on the mark list. Marks >z are named as aa (e.g.: aa, ab,...). Extending the default mark names, e.g. from ‘c’ to ’c-TD’, maintains the alphabetical sequence for default names in subsequently generated marks.
Mark information
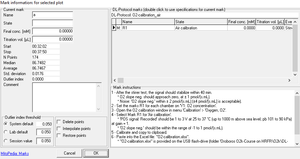
- Click on the horizontal mark bar to open the window Mark information: for selected plot.
- Name: Edit the mark name.
- State: An explanation of the mark name, frequently giving the units of concentration.
- Final conc.: (optional) The value is used as the concentration or pX value in the Amp or pX calibration windows.
- Titration vol. [µL]: In SUIT protocols, the value is entered as the volume of a titration, for calculating the dilution of sample in DatLab-Excel templates.
- Outlier index: 'High index' - see Details.
- Click on the horizontal mark bar to open the window Mark information: for selected plot.
- The following tick boxes can be selected
- Delete points: Delete data points in the selected mark (no data are lost).
- Interpolate points: Interpolate data points in the selected mark.
- Restore points: Reverses all data points in the graph if they have been deleted or interpolated.
Marks - DatLab 7
- In the Graph menu select "Mouse control: Mark", or press "Ctrl+M". Marks cannot overlap within a plot and are separated by one or more data points which are not marked
Keywords
- Bioblast links: Marks in DatLab - >>>>>>> - Click on [Expand] or [Collapse] - >>>>>>>
- Specific
- O2k-Procedures
- MiPNet O2k-Procedures
- » MiPNet26.06 DatLab 7: Guide - Section on setting Marks
- MiPNet O2k-Procedures
- General
MitoPedia O2k and high-resolution respirometry: DatLab


